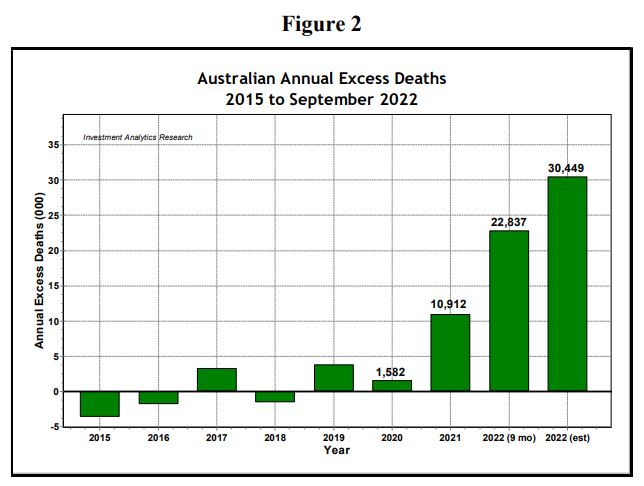
A pre-print study published in February 2023 by Dr. Wilson Sy shows an incredible analysis of excess mortality data in Australia. Based on his research and analysis of the data, Dr. Sy concluded that there is an excess death rate in 2021 that is 7-fold higher than than 2020 and 14-fold in 2022. The 2022 data was only available up to September 2022. Dr. Sy predicts the final months of 2022 could amount to a 19-fold increase overall for that year.
Yes, you heard that right: a 7-fold and potentially 19-fold increase in excess mortality in 2021 and 2022, respectively, over 2020, the “year of the pandemic”.
To be clear: Dr. Sy is not a medical doctor, but as you will see, his research and analysis is based solely off of data provided by the Australian Bureau of Statistics (ABS) and requires minimal, if any, medical expertise.
Dr. Sy began analyzing excess mortality data ranging back to 2015 through September 2022. He was able to draw concerning conclusions based on the ABS data:
Based on the data Dr. Sy analyzed, he was able to conclude that excess deaths increased from 1,582 in 2020 to 10,912 in 2021 and 22,837 in 2022 (thru September). He estimates the 2022 final number will be around 30,449, or more than 19 times the “pandemic year” of 2020.
He also concluded that “All Cause Mortality” began to significantly trend upward in 2021 as evidenced in the chart below:
According to Dr. Sy, Australia “moved the goal posts” for 2022: they changed the baseline definitions for calculating excess mortality by taking the average excess deaths of only four years, 2017-2019 and 2021, skipping 2020, rather than the “normal” baseline of the previous five consecutive years:
Why would the Australian authorities change the baseline definition by excluding 2020? And why was 2020 “significantly lower than expected” in certain periods despite the on going “pandemic” that destroyed the middle to lower class with draconian lockdowns and mandates?
One of the interesting observations from this report is that flu and pneumonia mortality in Australia dropped drastically in 2020. Dr. Sy notes that this could potentially be due to misdiagnosis of COVID-19 rather than influenza based on a
CDC “Lab Alert” that suggests the RT-PCR tests cannot differentiate between the COVID virus and the influenza virus. The CDC alert suggests labs “consider adoption of a multiplexed method that can facilitate detection and differentiation of SARS-CoV-2 and influenza viruses.”
In the chart below, the blue bars represent the 5-year average of Influenza and Pneumonia deaths. The red bars depict the 2020 death rates:
When you factor in COVID deaths, however, the months with the most dramatic differences shown above take a wild turn:

These conclusions are supportive of a claim made by J Scott Davison, the CEO of OneAmerica Insurance Company, back in January 2022. Davison joined an Indiana Chamber of Commerce roundtable discussion on the impacts of COVID-19. In this discussion, he revealed their group life insurance was seeing “the highest death rates they’ve ever seen in the history of this business”. He says this increase of 40% excess mortality over pre pandemic levels is consistent throughout the industry and that it is primarily working aged people that are 18-64 that are dying. Davison emphasizes that a “3-sigma or 1 in 200 year catastrophe would be a 10% increase over pre-pandemic, so a 40% [increase] is just unheard of. And what the data is showing us is that the deaths being reported as COVID deaths greatly understate the actual death losses among working age people from the pandemic. It may not all be COVID on their death certificate, but deaths are just up huge huge numbers.”
The findings shared by Davison are also consistent with an age breakdown of excess mortality in Australia, according to a
substack by Steve Kirsch. Kirsch found that the deaths in those aged 0-64 are significantly higher than other age demographics:


No comments:
Post a Comment